Shared mailbox analytics are the measurements that track how work moves through a shared inbox: message volume, ownership and assignment rates, response and aging times, workload distribution, and workflow health indicators such as reassignment frequency. This guide is for managers who run a shared inbox in Microsoft 365: it explains which metrics matter, what each one tells you, and how to use them together to judge whether your shared mailbox strategy is working.
Introduction
Shared mailboxes often function as core operational systems, yet they are frequently among the least measured components of Microsoft 365 environments. Teams rely on shared inboxes to manage customer inquiries, internal coordination, and time-sensitive communication, but many lack clear visibility into how those inboxes perform. Simply using a shared mailbox does not mean a team has an effective shared mailbox strategy.
Without analytics, shared mailbox management becomes reactive. Escalations drive attention. Staffing decisions rely on anecdote. Workflow changes are based on perception rather than evidence. Analytics introduce a different model. They make invisible work visible and allow teams to understand how messages move through shared inboxes over time. A successful shared mailbox strategy is measurable, repeatable, accountable, and scalable: it balances speed with quality, distributes workload fairly, and provides visibility into performance over time.
This article explains what shared mailbox analytics are, why they matter for Outlook-based teams, which metrics provide the clearest insight into shared mailbox performance, and how to use them to measure success. The focus is on system understanding rather than target-setting.
The importance of analytics becomes clearer when viewed through the Shared Mailbox Automation Framework, which describes how shared mailbox workflows evolve in maturity. Workflows at the lower levels operate with limited visibility, where performance is inferred rather than measured. As workflows mature, analytics become foundational, enabling teams to define ownership, evaluate responsiveness, understand where their team lands on SMAF, and improve operations based on observable patterns rather than assumptions.
Definition: shared mailbox analytics
Shared mailbox analytics are measurements that describe how work flows through a shared mailbox. They focus on demand, ownership, timing, workload distribution, and responsiveness across the team.
In Microsoft 365 shared mailboxes, analytics are used to understand how much work the inbox generates, identify where delays occur, assess whether workload is balanced, and evaluate consistency of response behavior.
Shared mailbox analytics describe how the mailbox operates as a system. They are not designed to rank individuals in isolation.
Why analytics are essential
Shared mailboxes differ from personal inboxes because responsibility is distributed. When delays occur, the cause is often structural rather than individual. Without measurement, diagnosing those causes is difficult.
Analytics replace assumptions with evidence. They surface patterns that are invisible in day-to-day handling. They support capacity planning and staffing decisions. They enable process improvement over time.
Most importantly, analytics shift conversations from effort to structure. Instead of asking why people are falling behind, teams can ask where friction is being introduced.
Start with customer satisfaction, but go deeper
Customer satisfaction is an important indicator. Post-interaction surveys, CSAT scores, and qualitative feedback reveal how customers perceive your responsiveness and professionalism. Persistent dissatisfaction clearly signals that something is broken.
However, customer satisfaction is a lagging indicator. It reflects outcomes after workflow issues have already affected the experience. High satisfaction does not necessarily mean your processes are scalable, and low satisfaction does not automatically identify where breakdowns occur.
Use customer feedback as a baseline, but rely on the operational metrics below to understand what drives those outcomes.
Volume metrics: understanding demand
The first dimension of shared mailbox analytics is demand.
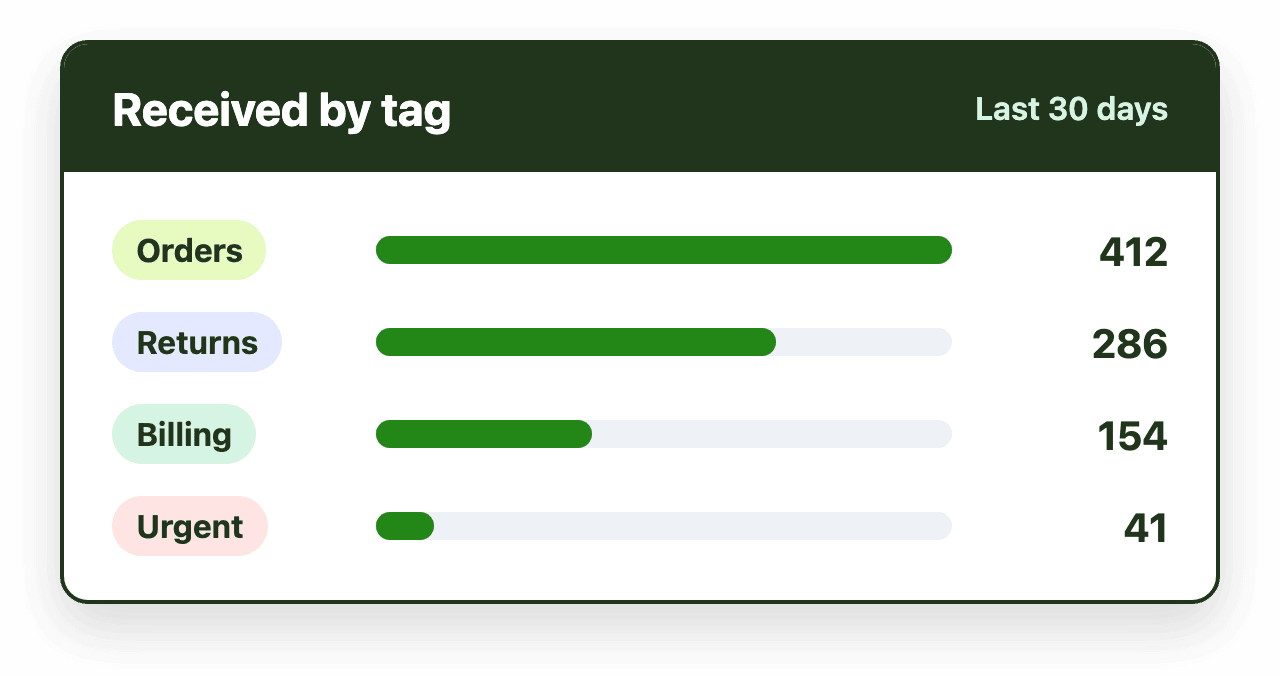
Message volume measures how many emails arrive over a given period. Volume can be examined by day, week, or month, as well as by time of day. These trends reveal seasonality, growth patterns, and recurring spikes.
Message mix adds necessary context. An inbox may receive billing inquiries, operational updates, support questions, and internal requests simultaneously. Understanding this mix helps align routing and staffing with the actual type of work being generated.
Volume without context leads to misleading conclusions. Demand must be interpreted in relation to complexity and workflow.
Ownership and assignment metrics
Ownership metrics describe how responsibility is established and distributed. Ownership is one of the strongest predictors of shared mailbox success: every message should have a clearly visible owner, and ownership should be established promptly after arrival.
Assignment rates measure how consistently incoming messages are assigned to a defined owner. Low assignment rates often signal reliance on informal coordination.
Assignment timing measures how quickly messages are assigned and how often they remain unowned. Delayed ownership often precedes delayed responses. When responsibility is unclear, coordination stalls and messages wait unnecessarily.
Ownership distribution shows how work is spread across the team. Persistent imbalance suggests structural issues in routing or load balancing.
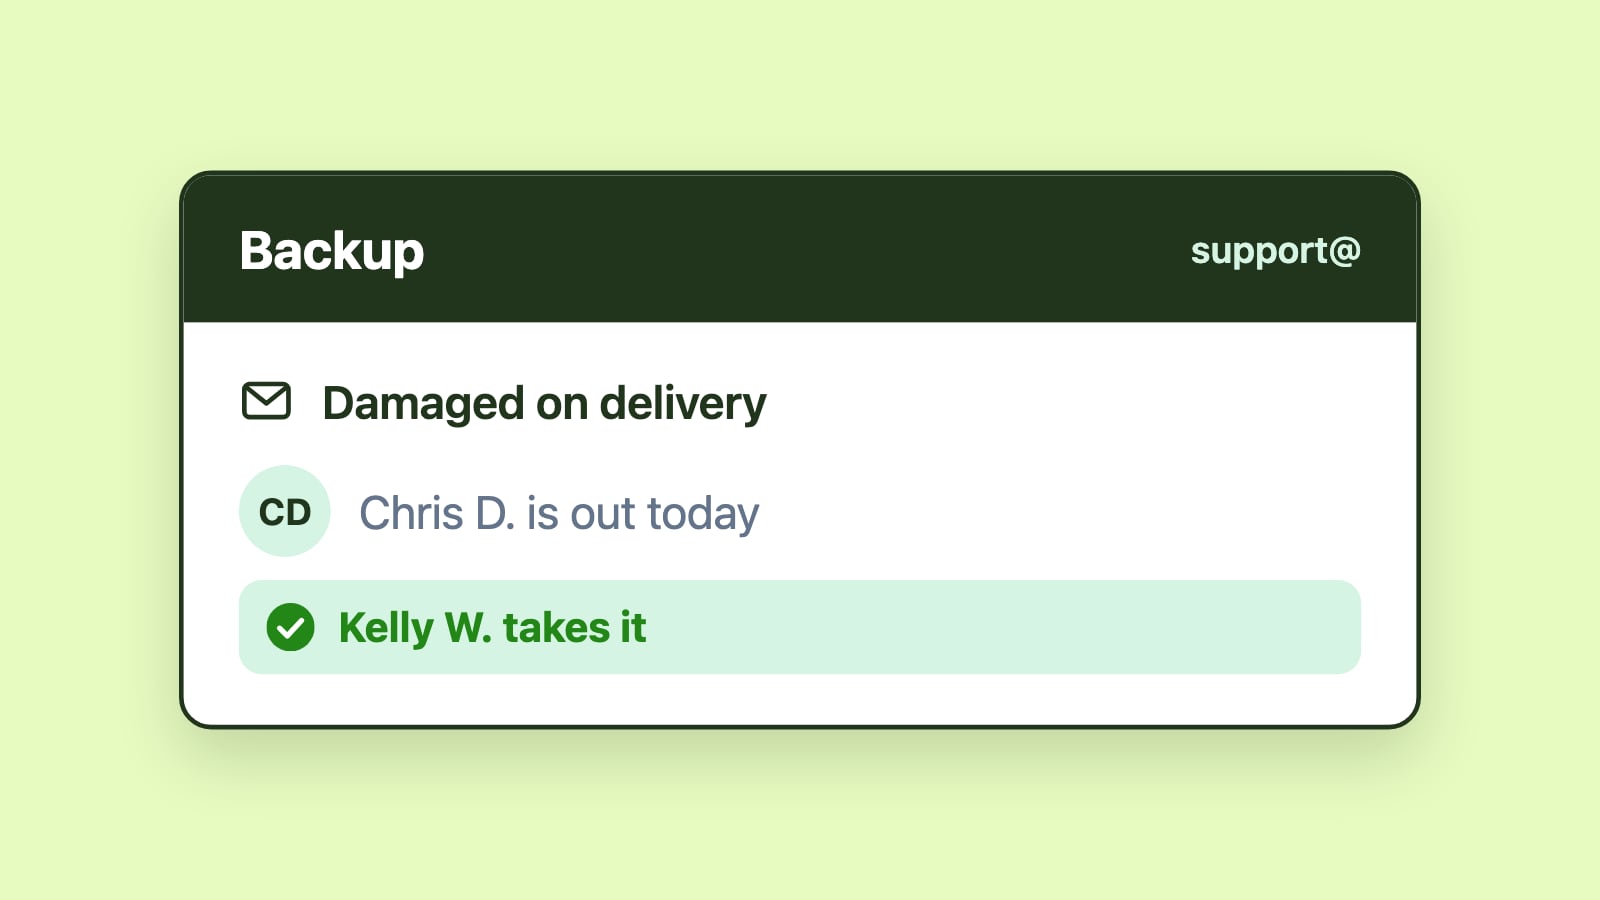
These metrics move discussions from perceived workload to actual distribution of responsibility. Strategies that make ownership explicit, visible, and easy to transfer when needed typically see less duplication and fewer internal escalations.
Time-based metrics: responsiveness and delay
Time-based analytics reveal how quickly the system moves.
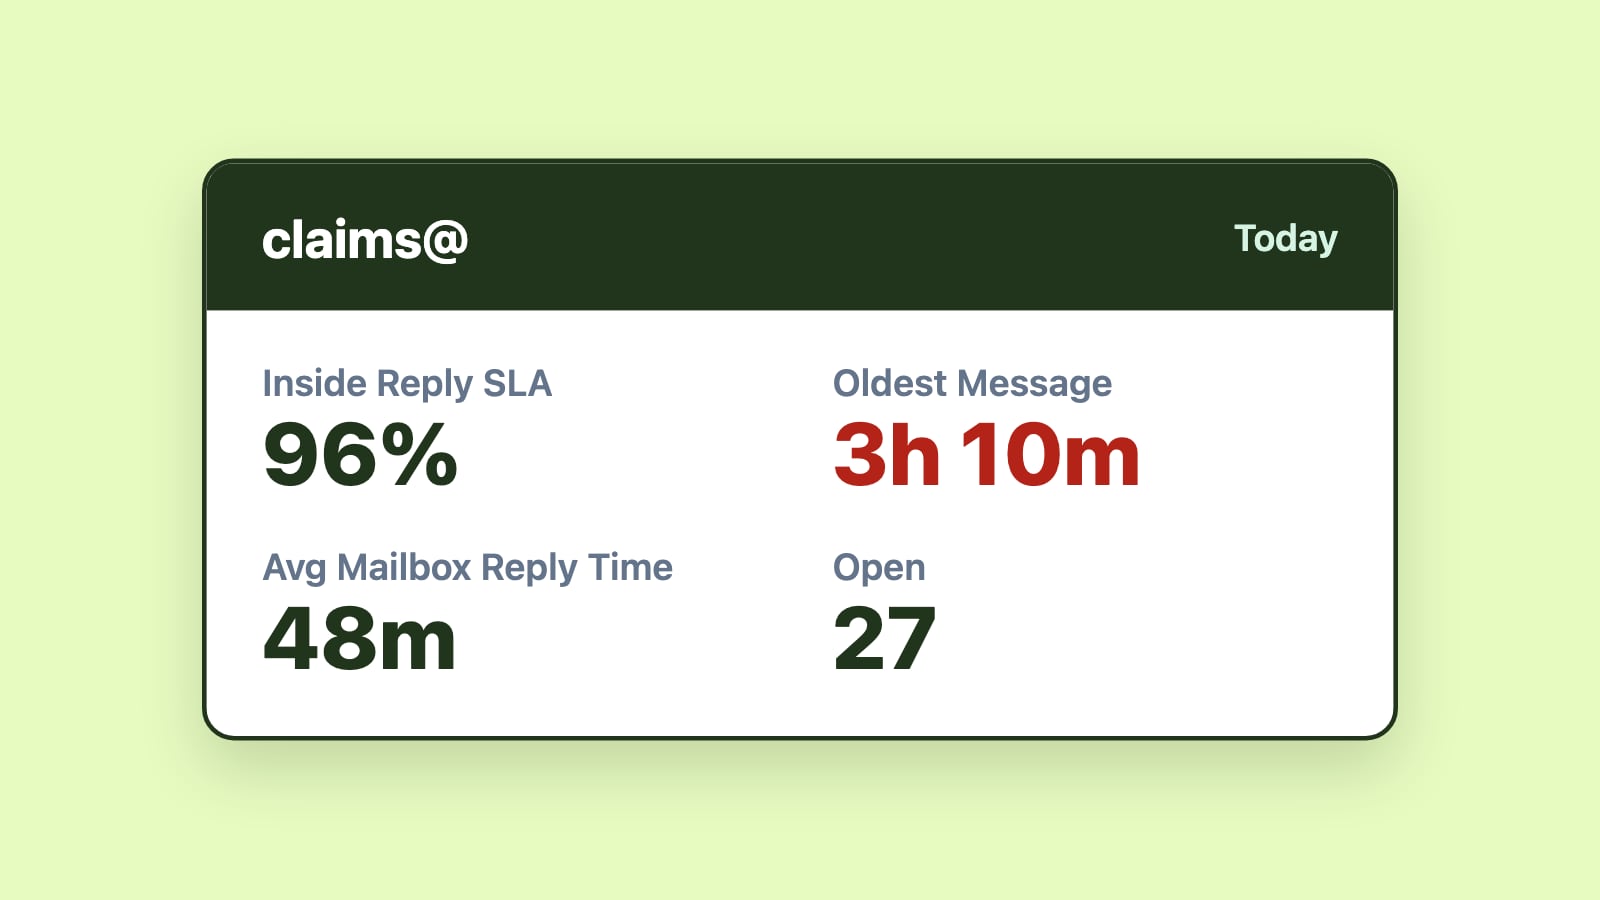
First-response time measures how long it takes for a message to receive an initial reply. This metric reflects external responsiveness and is often tied to SLA tracking and service expectations. Resolution time measures how long it takes to fully address the issue.
Aging metrics show how long unresolved messages have been waiting. Rather than focusing solely on averages, aging distributions highlight whether a subset of messages is consistently delayed.
Backlog size measures how much work remains unresolved at any given moment. Combined with aging, backlog reveals whether accumulation is temporary or structural.
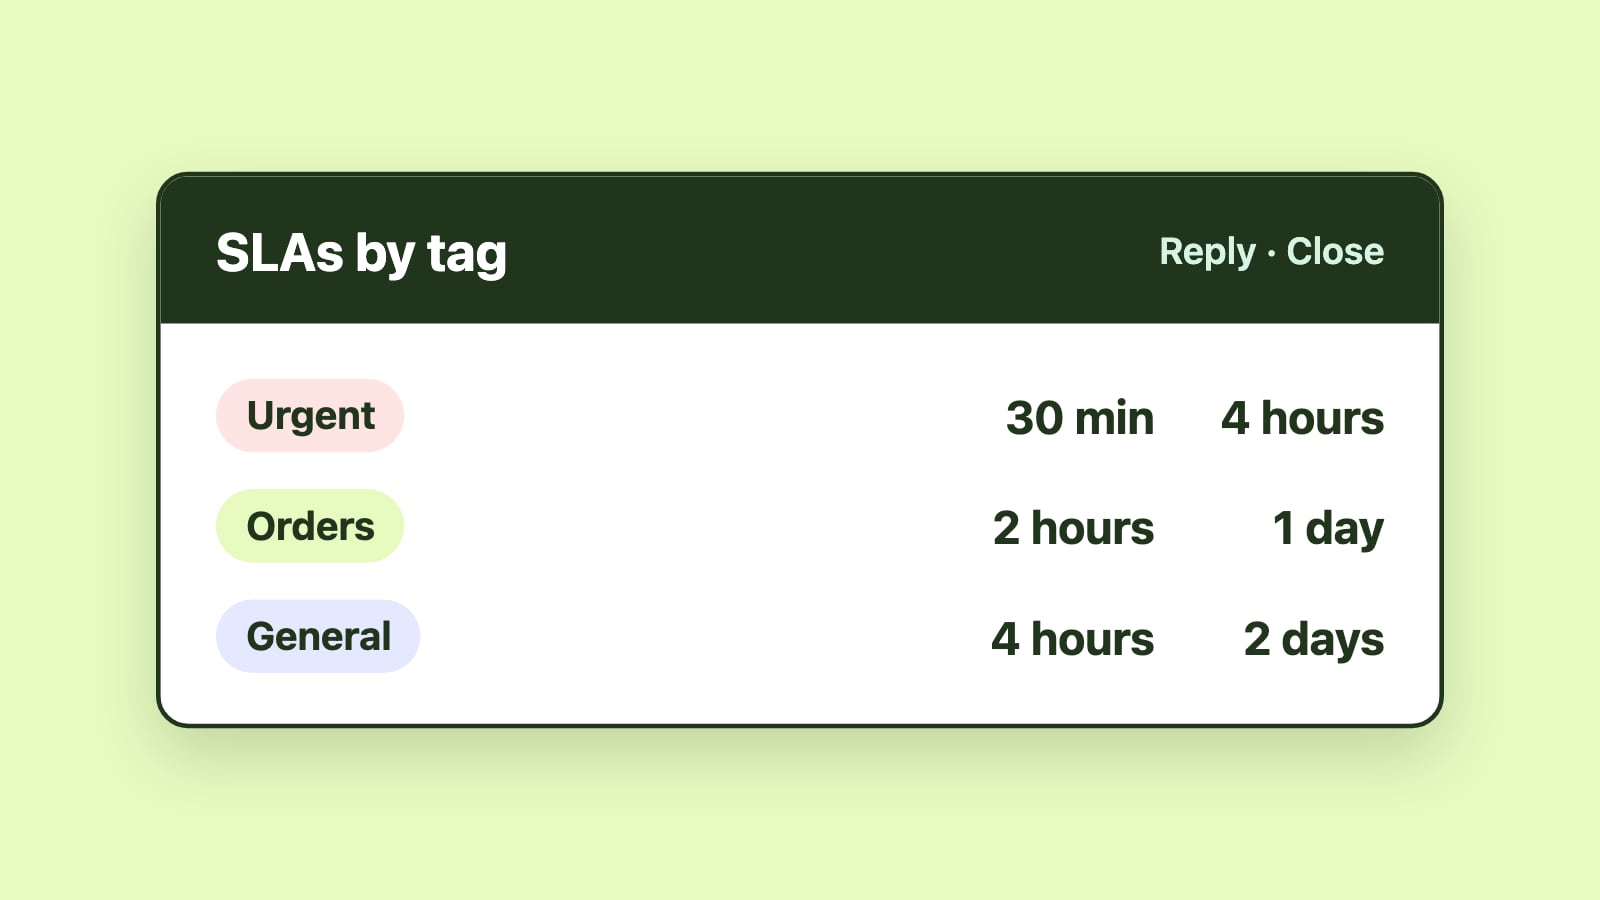
SLA metrics show which messages have waited past defined response thresholds and how often targets are met. These signals show teams where to intervene and which waiting messages to handle first.
Read response time in context
Speed alone does not equal success. If response-time measurement is disconnected from quality, teams may feel pressure to send rushed or incomplete replies. The goal is not simply faster responses, but consistent and appropriate responses.
Look at trends over time rather than isolated figures. Are response times stable as volume increases? Do certain inboxes, shifts, or teams consistently lag behind? Pattern analysis reveals whether your workflow is resilient or fragile.
Workload distribution metrics
Workload metrics describe the active state of the inbox. Shared mailboxes exist to distribute work across a team, and without visibility into workload distribution, it is impossible to know whether that distribution is actually occurring.
Active workload measures how many messages are currently unresolved. This provides a real-time snapshot of system pressure.
Load variance examines differences in active workload across team members or queues. If a small number of team members consistently handle a disproportionate share of messages, delays and burnout become likely. If volume spikes consistently overwhelm the team, backlog will accumulate and response performance will degrade.
These metrics are especially useful in planning discussions, as they connect demand with capacity. A sustainable strategy maintains balance: volume growth should not automatically translate into slower responses or declining morale, and even distribution of work is a leading indicator of long-term performance stability.
Workflow health indicators
Some analytics describe workflow health rather than performance outcomes.
Reassignment frequency indicates how often messages change owners. High reassignment rates may reflect unclear routing logic or excessive handoffs.
Idle time measures how long messages remain unassigned after arrival. Excessive idle time often points to triage or ownership gaps.
Escalation rate shows how often issues move up the chain. Some escalations are necessary, but a consistently high rate often indicates structural gaps: if frontline teams lack authority, context, or clear ownership, issues move upward unnecessarily, increasing internal friction and reducing responsiveness. A healthy workflow resolves most issues at the appropriate level without repeated transfers or confusion.
These indicators help teams identify friction in coordination rather than simply measuring speed.
Response consistency and quality
Response quality is harder to measure than speed, but it is equally important. Review message samples periodically to evaluate clarity, tone, completeness, and accuracy.
Consistency across responders is a sign of strong workflow design. If customers receive noticeably different levels of detail or professionalism depending on who replies, the strategy is not yet stable.
Quality review does not need to be constant or intrusive. Trend-based sampling over time is often sufficient to identify improvement areas.
Analytics as a feedback loop
Shared mailbox analytics are most effective when treated as a feedback loop. Metrics reveal how the system behaves under real conditions, but measurement only matters if it informs change.
Analytics help answer practical questions. Where are delays introduced? Which types of requests generate the most backlog? How does volume affect response time? What changes improve consistency?
High-performing teams review shared mailbox metrics consistently and adjust workflows based on what they observe. Regular review creates a feedback loop where data drives refinement rather than reaction, which matters because volume fluctuations, staffing changes, and evolving customer expectations all affect inbox performance.
Used responsibly, analytics guide structural adjustments rather than punitive measures.
Staying Outlook-native with analytics
Native Outlook and Microsoft 365 tools provide limited insight into shared mailbox performance. Basic views show message lists, but they do not reveal ownership timing, workload concentration, backlog trends, or SLA performance in a systematic way.
For Microsoft 365 teams, analytics adoption improves when insights are visible alongside daily work. Reports that live outside Outlook often become disconnected from behavior. Outlook-native shared mailbox management platforms surface analytics in context, allowing teams to connect metrics directly to messages and workflows.
Emailgistics is a Microsoft 365-native shared mailbox management platform that provides shared mailbox analytics, automated assignment, workflow routing, and SLA tracking inside Outlook. Instead of relying on spreadsheets or manual audits, managers get customizable dashboards with up-to-the-minute visibility of their most crucial KPIs, so they can address service issues as they appear.
What analytics do not provide
Analytics do not replace clear ownership, effective routing, defined response expectations, or human judgment.
Metrics describe behavior. They do not correct it automatically. Their value lies in enabling informed decisions.
Measuring success means measuring readiness to scale
Ultimately, the success of a shared mailbox strategy is defined by its ability to scale without sacrificing reliability. Clear ownership, balanced workloads, consistent response behavior, and visible accountability indicate a system designed for growth. When these elements are measurable, they become manageable, and shared mailbox performance shifts from reactive problem-solving to deliberate optimization.
Conclusion
Shared mailbox analytics provide visibility into how team email workflows actually operate. By tracking volume, ownership, time-based metrics, workload distribution, and workflow health indicators, and reviewing them alongside customer feedback and response quality, Microsoft 365 teams gain a system-level understanding of shared mailbox performance. Analytics do not prescribe outcomes, but they enable decisions that improve consistency, responsiveness, and sustainability over time.